
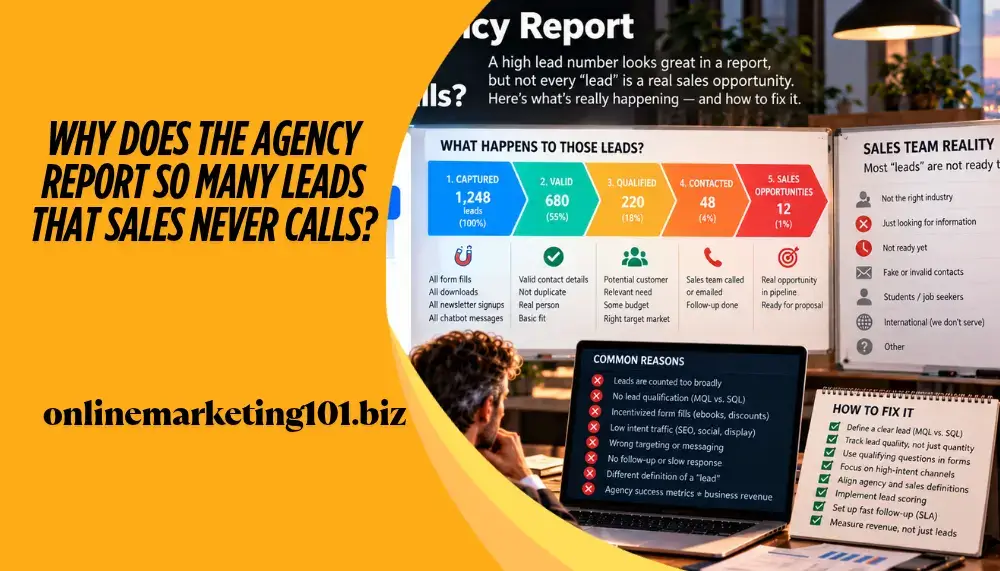
Why Does the Agency Report So Many Leads That Sales Never Calls?
Most “bad leads” are not bad leads – they are the result of two teams using the same word to mean completely different things. In this guide, I will show you how to define a qualified lead together, how to measure the same result, and how to permanently end the cold war between marketing and sales.
The Sentence Every Agency Knows
“You brought us twenty leads again, and I couldn’t call any of them.”
If you run an agency, you have heard this sentence before. If you are a sales manager, you have probably said it yourself. And both sides are right – according to their own metrics. The marketing report is green: lead volume is increasing, cost per lead is falling, and campaigns are reaching their targets. The sales report, however, is red: the acceptance rate is falling, contact time is increasing, the pipeline is empty, and the number of closed deals is not moving.
The conflict almost never begins with advertising quality. The conflict begins with the definition. As long as marketing counts anyone who fills in a form as a lead while sales expects someone who is immediately ready to request a proposal, the two reports do not describe the same reality – they are simply looking at the same rows through two different pairs of glasses.
This article is not about how to generate more leads. It is about how to create the agreement that makes a lead count. Because volume alone has never been a business outcome – and management decisions are not based on the number of leads, but on how much revenue those leads ultimately generate.
First, I define the qualified lead together with sales: need, budget, location, timing and – where relevant – decision-making authority. Then I compare channel reports with acceptance and close rates so that both teams measure the same outcome.
First Step
What Is a Qualified Lead? The Five Criteria
A qualified lead (Marketing Qualified Lead, or MQL) is not simply a status inside the CRM, but a jointly agreed definition. If marketing creates the definition alone, sales will not accept it. If sales creates it alone, marketing will not be able to deliver against it. The solution is a definition both teams can see, understand and accept – before any campaign is launched.
The following five criteria form the framework we use in practically every B2B and service-based project. The order is deliberate: it reflects the filtering logic through which raw interest becomes a business opportunity.
Need
A real, clearly expressed problem or objective that our service can solve. Not “curiosity,” not “comparison research,” and not a student project. A useful qualification question is: what is the specific business pain, and what happens if it is not solved?
Budget
It does not necessarily have to be an exact amount – but there should be an accepted range. A “above €5,000” filter can dramatically reduce the proportion of leads that sales cannot realistically work with while barely affecting the real customer base. Missing budget is one of the most common silent killers.
Location
The geographic or language-based service area. If the company operates only in Budapest and Pest County, an inquiry from Szeged or Cluj-Napoca is not a lead – it is expensive noise that consumes the salesperson’s time.
Timing
When will the project begin? “Maybe next year” is not timing. The 0–30, 31–90 and 90+ day ranges clearly separate contacts who should be called immediately from those who should enter a nurture process – eliminating the “I didn’t call because they weren’t going to buy now anyway” argument.
Decision-Making Authority
Where relevant: who signs the proposal? A form completed by an intern or assistant becomes much more valuable if we also know the name and contact information of the decision-maker – and less valuable if we do not.
+1: Exclusion Criteria
Half of a good definition is often the “who is NOT a lead” list: competitors, job seekers, free-consultation hunters, B2C inquiries in a B2B campaign, spam and bot traffic. We document these in writing because this is where most report comparisons break down.
This Is What a Working One-Page Lead Definition Looks Like
It does not need to be a complicated document. One page, six fields, approval from the leaders of both teams – by signature or explicit email approval – and a date until which the definition remains valid. Example for a Hungarian service company:
Diagnosis
Seven Real Reasons Why Sales Does Not Call the Lead
Before changing anything, we need to understand where the disconnect comes from. In the overwhelming majority of cases, we find one – or a combination – of the following seven causes. It is worth reviewing them in order because each requires a different remedy.
There Is No Shared Definition
Marketing counts a “completed form” as a lead, while sales expects “purchase intent.” The same data means two different things. This is the default situation at most companies – and it is also the cheapest problem to fix.
Different Incentives (KPIs)
The agency is measured on lead volume and CPA, while sales is measured on closed deals and revenue. When incentives pull in different directions, behavior follows. This is not a human failure; it is a system failure.
Attribution and Timing Gap
SEO and content-marketing leads often close months later. If sales thinks in a 30-day window, even a good lead appears “weak” – when in reality it simply matures differently.
Data-Quality Problems
Incorrect phone number, private email instead of business email, “asdf” in the name field, duplicate records or missing company size. The form may have been too short – or too long, causing people to submit it half completed. Both lead to the same problem.
No Feedback Loop
The agency never finds out why a lead was rejected. Without this information, it repeats the same mistake month after month, while sales understandably feels that “nobody listens to us.”
Capacity Shortage and No SLA
If sales has no explicit commitment regarding how quickly a lead must be contacted, leads get lost in the queue. Research and practical experience point in the same direction: the first 5–30 minutes can have a major impact on the success of making contact.
Deteriorating Targeting and Channel Drift
A campaign that performed exceptionally well for three months eventually becomes fatigued: the same audience, banner blindness, cheaper and weaker placements, expanding lookalike audiences. Volume remains, but quality slowly leaks away – and only comparative measurement reveals it.
Measurement
Measuring the Same Outcome: The Logic of Channel Comparison
The second step – and in my view the most valuable part of the entire system – is to compare channel reports with acceptance and close rates. Lead volume on its own is a meaningless number. It becomes useful for decision-making only when we place beside it the two ratios that show what happened to the lead beyond the marketing boundary.
The Funnel Both Teams Need to Understand
- Lead Volume: how many records arrived from the given channel.
- Acceptance Rate / Sales Accepted Lead: how many were accepted by sales according to the shared definition. This is the most important metric at the bridge between the two teams.
- Contact Rate: how many accepted leads were actually reached within the agreed time.
- Opportunity Rate / MQL→SQL: how many conversations became genuine pipeline opportunities.
- Close Rate: how many opportunities became customers.
- Revenue and ROI: how much revenue the channel generated and how much it cost. This closes the loop – and this is what management decisions should ultimately be based on.
| Metric | What Does It Show? | Who Owns It? | Healthy Direction |
|---|---|---|---|
| Lead Volume | The channel’s “volume” | Marketing / agency | Growing, but not as an end in itself |
| Acceptance Rate (SAL) | Fit with the definition | Shared | Stable or increasing |
| Contact Time | Speed and discipline | Sales | Decreasing (within SLA) |
| MQL → SQL Rate | Depth of genuine interest | Shared | Increasing |
| Close Rate | Offer and market fit | Sales | Stable |
| Revenue per Lead | Business value | Shared | Increasing |
| Distribution of Rejection Reasons | Diagnosis, not blame | Shared | Fewer and fewer “no reason” records |
Why Is the Acceptance Rate the Key Metric?
Because it is the only number to which both sides must contribute. Marketing cannot say, “we handed it over; the rest is not our problem,” because acceptance evaluates the quality of the leads we delivered. Sales cannot say, “they are all bad,” because acceptance decisions must be made according to their own written rules.
In practice, this is how we build the report: for every channel – organic search, PPC, LinkedIn, newsletter, content download and referral – we show lead volume, acceptance rate, contact rate, close rate and revenue generated by the channel in separate rows. Once these five numbers sit next to one another, it becomes immediately clear which channel is cheap and weak, which is expensive and excellent, and which one simply needs to be stopped.
Organic channels – namely search engine optimization and content marketing – typically deliver more slowly but more sustainably and with a higher acceptance rate. Paid channels generate volume faster, but they are more sensitive to deterioration in targeting. If this difference is not communicated to sales in advance, tension in the second month is almost guaranteed. We summarize our detailed methodology in the on-page and off-page SEO guide.
System
Rejection Taxonomy: Not “Bad Lead,” but a Reason
The fastest improvement does not come from a new campaign, but from a dropdown field in the CRM. If the salesperson rejects a lead, they must select a reason from a predefined list. A free-text comment is not enough – you cannot build a reliable report from it, and you cannot see trends.
Unreachable
Incorrect or non-working phone number, bouncing email, or no response after 3 attempts.
No Budget
The customer does not have sufficient funds or is well below the minimum threshold.
Outside Service Area
Does not meet the geographic or language criteria.
Wrong Timing
Genuine interest, but on a 6–12 month horizon. Goes into nurture, not into the trash.
Competitor / Researcher
Market research, agency comparison or student work.
Not a Decision-Maker
Has no authority and did not provide access to an identifiable decision-maker.
Duplicate / Old
Already exists in the system or is a previously lost customer.
Spam / Bot
Automated submission, test data or meaningless field content.
Does Not Fit the Portfolio
Looking for a service we do not provide.
Once this list has been used for three months, you have one of the most valuable datasets a marketing organization can own: the distribution of rejection reasons by channel. If “no budget” dominates PPC, targeting and messaging need to be narrowed. If “unreachable” dominates a specific form, the form needs to be rebuilt. If “spam” is high, technical protection is needed. If “wrong timing” is the largest category, however, there is no lead-quality problem – there is simply no nurture system, and solving that is marketing’s responsibility rather than sales’.
This shift in perspective eliminates much of the conflict by moving the discussion away from people and toward processes. The question is no longer “who is right?” but “which rejection reason is increasing, and which setting do we need to change?”
Agreement
SLA and Feedback Loop: The Two-Way Commitment
A Service Level Agreement in this context is not a legal document, but a simple two-way commitment. Marketing promises something about data handoff, while sales promises something about processing. If only one side commits, the system becomes unbalanced.
Marketing’s Commitments
- Every lead arrives with the minimum fields required by the shared definition.
- Real-time, automatic handoff into the CRM – not a weekly Excel file.
- Channel, campaign and source labels on every record.
- Bot and spam filtering before handoff.
- Monthly reporting that includes acceptance and close rates.
Sales’ Commitments
- First contact within the agreed timeframe (typically within 1 business day, ideally within 1 hour).
- Record the status of every lead: accepted or rejected.
- If rejected, select a mandatory reason from the taxonomy.
- Attend a weekly 30-minute joint review with marketing.
- Feed close and loss reasons back into the system.
The Weekly 30 Minutes That Changes Everything
We introduce a short meeting with a strict agenda: every week, the agency and the sales manager review the previous week’s leads. It is not a presentation and not a status report – it is a record-level review. There are only three questions:
- Which lead was accepted, and why? (This teaches us what to strengthen.)
- Which lead was rejected, and why? (This teaches us what to narrow.)
- What will we change next week? (One, maximum two concrete adjustments.)
This meeting works because it is small, concrete and consequential. Every session produces a decision, and the following week its impact can be seen in the numbers. Within three months, the same two people typically have completely different conversations – speaking the language of joint optimization instead of defensiveness.
Implementation
30-Day Implementation Plan
The system should not be introduced all at once in one major rollout – resistance from the teams would be almost guaranteed. We use a four-stage, thirty-day schedule in which every step produces a visible result.
Week 1 – Definition and Baseline
- Joint workshop with sales: define the five criteria using concrete thresholds.
- Document the exclusion criteria.
- Finalize the rejection taxonomy (maximum 10 reasons).
- Measure the baseline: retag the previous 3 months of leads so there is something to compare against.
- Have the one-page definition document approved by both managers.
Week 2 – Technical Integration
- Create CRM fields: source, channel, acceptance status, rejection reason and first-contact time.
- Review forms: request the fields required by the definition and remove unnecessary ones.
- Enable spam and bot filtering and duplicate handling.
- Automatic real-time handoff into the CRM with notification to the relevant salesperson.
- Build the reporting template using the six funnel metrics.
Week 3 – Run the System and Create the First Feedback Loop
- Launch the weekly 30-minute review on a fixed day at a fixed time.
- Introduce and measure the SLA: how quickly does the first call happen?
- Review the first 20–30 rejected leads at record level.
- Implement one targeting or messaging adjustment based on what you find.
- Launch the nurture branch for leads classified as “wrong timing.”
Week 4 – Evaluation and Fine-Tuning
- Prepare the first complete monthly report: acceptance and close rates by channel.
- Review the definition: which criterion was too strict, and which was too loose?
- Reallocate budget toward channels with a demonstrably better acceptance rate.
- Retarget paid campaigns – see our PPC campaign management methodology.
- Integrate the process into the monthly client report so the client sees the same picture.
Reporting
How Should You Communicate the Results to Management?
Management is not primarily interested in lead volume; it wants to know whether marketing spend generates business results. That is why we always build the report in reverse order: revenue first, pipeline second, and lead volume only third.
- Page 1 – Business Results: revenue by channel, ROI, average customer size and backward-looking close rate.
- Page 2 – Pipeline Health: number of accepted leads, MQL→SQL rate, average cycle time and pipeline coverage.
- Page 3 – Activity: lead volume, CPA, conversion rate and traffic sources – for context, not as primary KPIs.
- Page 4 – Lessons and Next Steps: what we changed, what effect it had and what we plan next. This is the section that separates the report from generic monthly emails.
When an agency reports this way, the “lots of leads, poor quality” argument disappears because the conversation already takes place in a shared language – the language of revenue. This is the point where the agency moves from supplier to growth partner, and where sales also begins to treat marketing results as its own.
Fewer, but Better
The objective is not the maximum number of leads, but the maximum number of accepted and closed leads from the same budget.
Shared Metric
When both teams are tied to the same ratio, finger-pointing disappears.
Revenue Center
Marketing success is measured not by clicks but by closed contracts. Everything else is an intermediate signal.
Summary
The Essential Points in Five Steps
- The lead definition must be created jointly – need, budget, location, timing and decision-making authority, supplemented by an explicit exclusion list.
- Channel reports must be compared with acceptance and close rates – otherwise marketing and sales measure two different realities using the same word.
- A rejection should have a reason, not an opinion – taxonomy is the fastest route to genuine diagnosis.
- The SLA is two-way – marketing commits to accurate data and real-time handoff, while sales commits to fast contact and recorded status.
- A weekly 30-minute record-level review is worth more than any quarterly strategy workshop.
If these five points are working, the question “why don’t you call our leads?” simply disappears – because there are no longer two separate lists. There is one list, with one definition, one owner and one metric. This is exactly how marketing and sales become a single growth team.
Frequently Asked Questions
Questions and Answers
What Is the Difference Between an MQL and an SQL?
How Quickly Should a Lead Be Called?
What Should I Do If Sales Simply Refuses to Cooperate?
Can a Lead Definition Be Too Strict?
Are SEO Leads Really Better Than Paid Leads?
What Tools Do We Need for All of This?
How Long Before the Results Become Visible?
Shall We Take the Strategy Further?
If your agency delivers plenty of leads but sales cannot process them – or, conversely, if you are in sales and feel that marketing is measuring something different from you – let’s look at the numbers together. We will review your channel reports, build the shared lead definition and SLA, and implement the feedback loop.
Contact & Free ConsultationMore than 15 years of SEO and online marketing experience · Premium solutions at accessible prices · Since 2009